Visualisation
Visualisation online
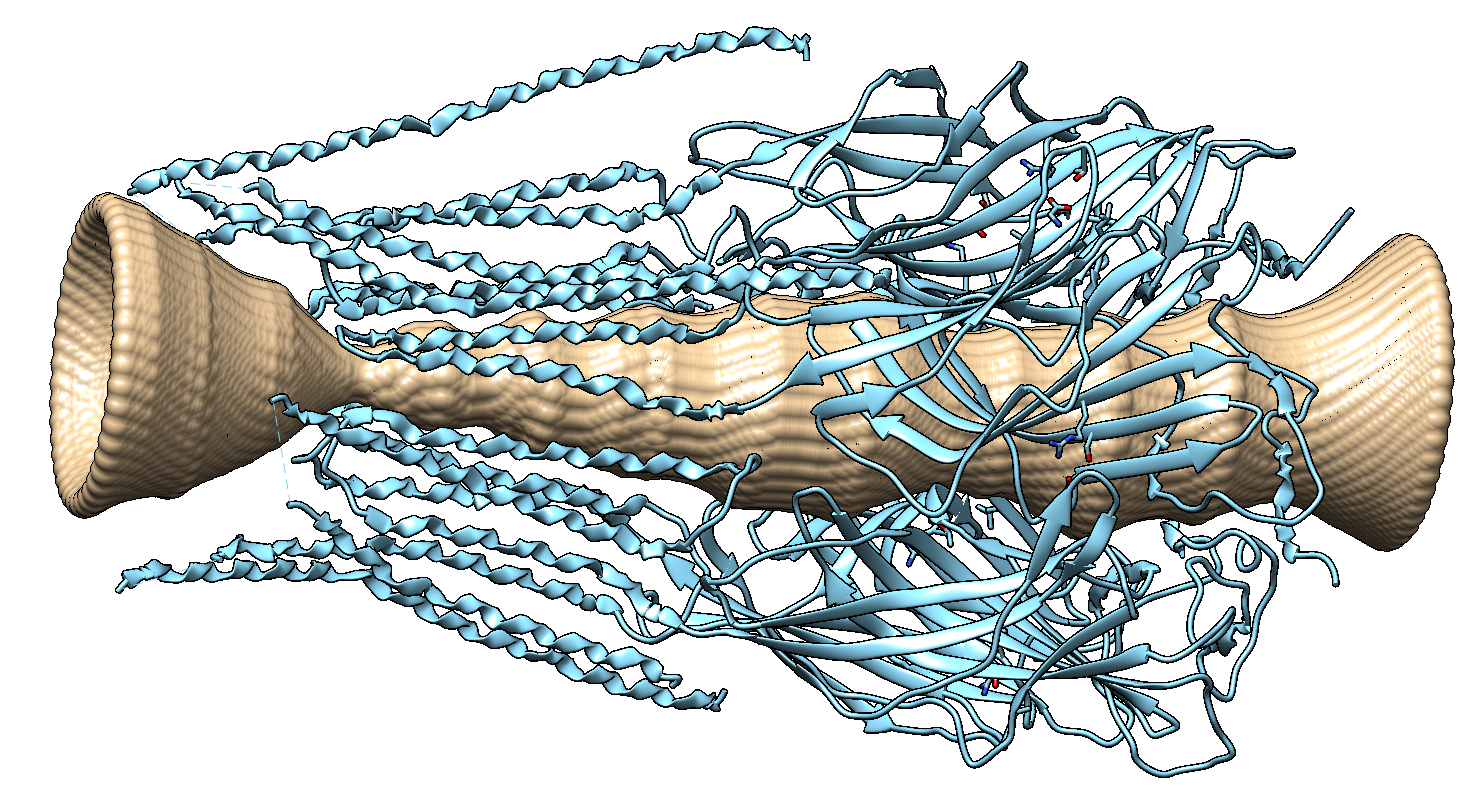
When you upload your protein(s) to the interactive web-service a streamlit app runs in the background and plots the radius profile and 3d visualisations of the pore and the protein both for spherical and ellipsoidal probe particles.
Pore profile visualisation in Python
py3Dmol
After initialising the “PoreAnalysis” class und running the “hole_analysis” method, you can use the “pathway_visualisation” method that returns a py3Dmol.view object.
>>> pdb_array = [p+'8fe1.pdb']
>>> c = PoreFinding.PoreAnalysis(pdb_array, num_circle=20,)
>>> c.hole_analysis(plot_lines=True, legend_outside=False, title='', f_size=15, )#
>>> c.pathway_visualisation(index_model=0, f_end='_circle.pdb')
After having used an ellipsoidal probe particle with the “ellipsoid_analysis”method, the “pathway_visualisation” method can be called with parameter “f_end=’_ellipsoid.pdb’”:
>>> c.ellipsoid_analysis(index_model=0)
>>> c.pathway_visualisation(0, f_end='_ellipsoid.pdb')
nglview
The “pathway_visualisation” method returns a py3Dmol object. Alternatively, one can use nglview , an IPython/Jupyter widget to interactively view molecular structures and trajectories.
Pore profile visualisation with VMD, Pymol or Chimera
The vmd visualisation script, the pymol visualisation script and the chimera visualisation script can be downloaded from the github repository. The scripts visualise the pore surface and the pathway in the pore. They are in output folder of the streamlit app as well.
VMDs
Script: visualise_pathway_hole.tcl Inputs: pdb and vmd file
>>> vmd -e visualise_pathway_hole.tcl -args 7tvi_aligned_z.pdb 7tvi_aligned_z.vmd

Pymol
The pore surface can also be visualised with pymol . The pymol_pore_visu.py script loads the pdb file (specified by “-structure” flag) and the corresponding point cloud (specified by the -surface flag). The point cloud with a surface representation visualises the pore.
>>> pymol -r pymol_pore_visu.py -- -structure 7tvi_aligned_z.pdb -surface 7tvi_aligned_z.pdb_circle.pdb

Chimera
The 3d pore can also be visualised with UCSF Chimera . The chimera_pore.py script loads the pdb file (specified by the user in the script) and the corresponding point cloud into chimera. The point cloud with a surface representation visualises the pore.
# change to folder with data files
path = 'CHANGE_THIS_TO_YOUR_PATH'
fname = 'YOUR_INPUT_FILE_aligned_z.pdb'
os.chdir(path)
file_names = [ fname + '_circle.pdb', fname]